SDG Dashboard for RTVE
An interactive dashboard about the relationship between RTVE television and radio programs with the SDGs.
How much are sustainable development goals discussed on public television and radio?
Political Watch has been analyzing RTVE's television and radio programs since 2015. This represents thousands of hours cataloged according to their content. An enormous technological effort, making use of artificial intelligence, that needed a suitable interface.
We were asked to develop a dashboard that would visually and interactively display data from RTVE's television and radio programs.
Objectives
- A private-use dashboard that would allow answering certain questions about the relationship between RTVE's television and radio programs with the SDGs.
- They wanted to answer questions such as:
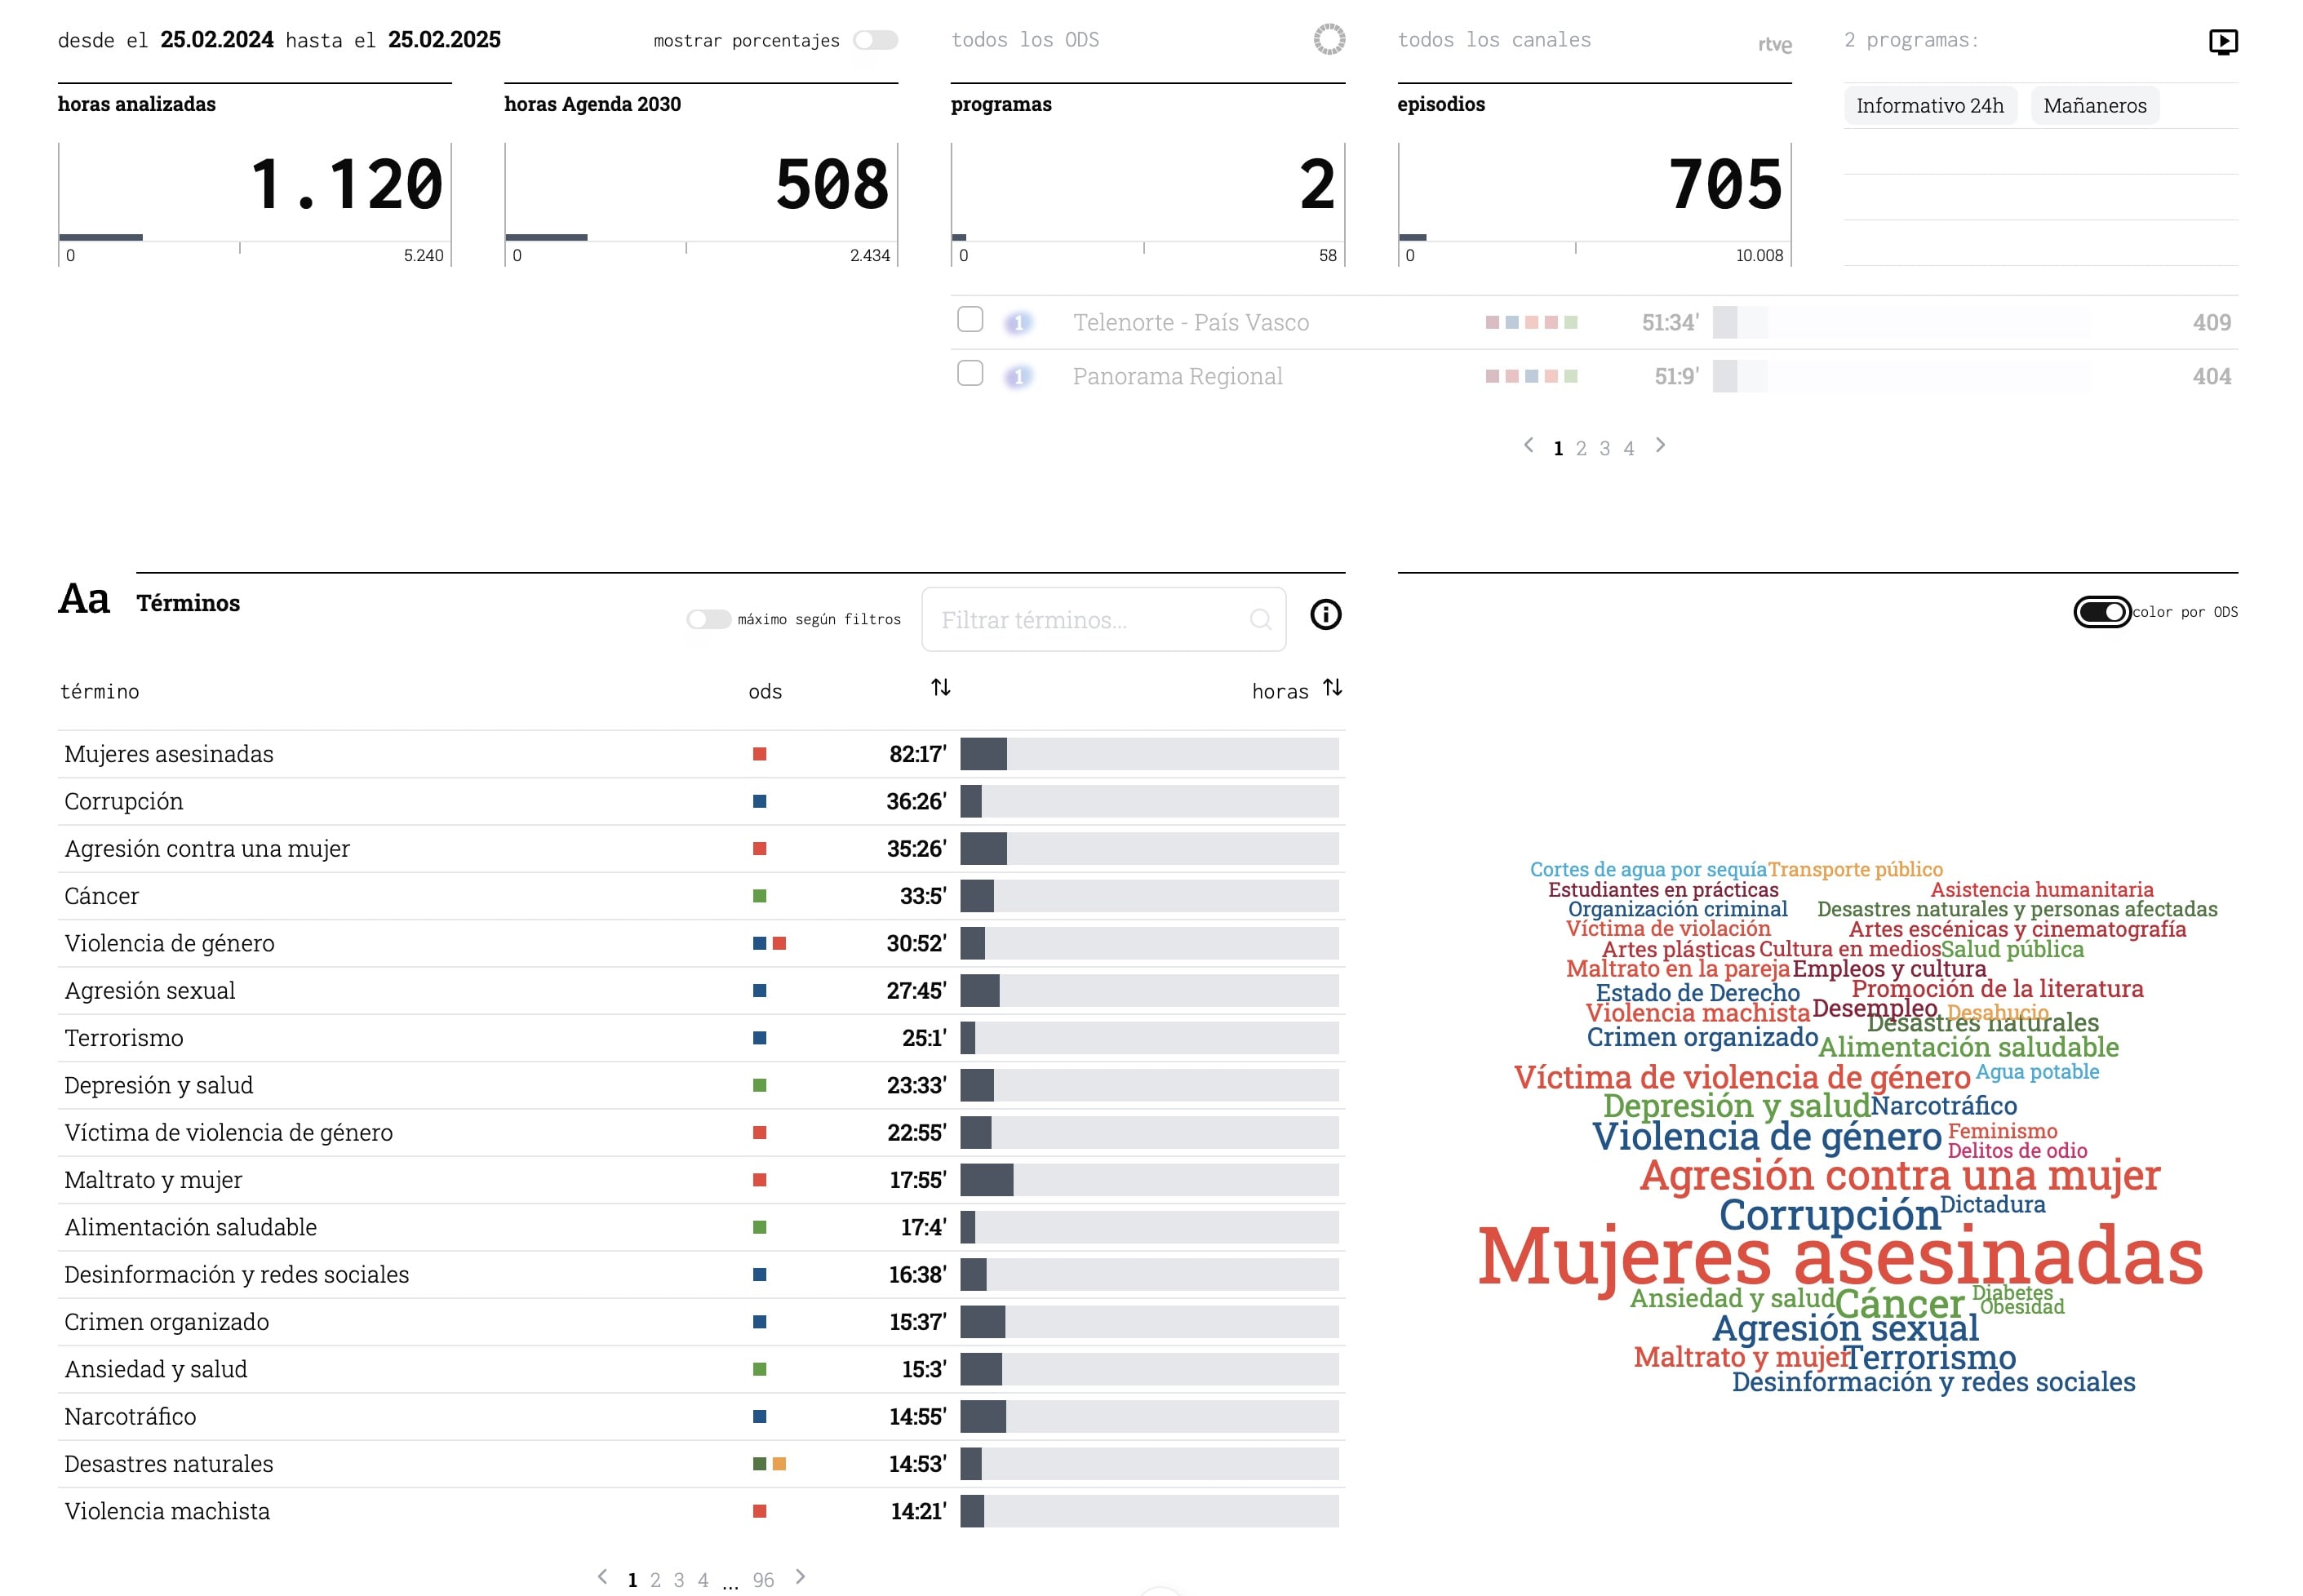
- How many programs have been analyzed?
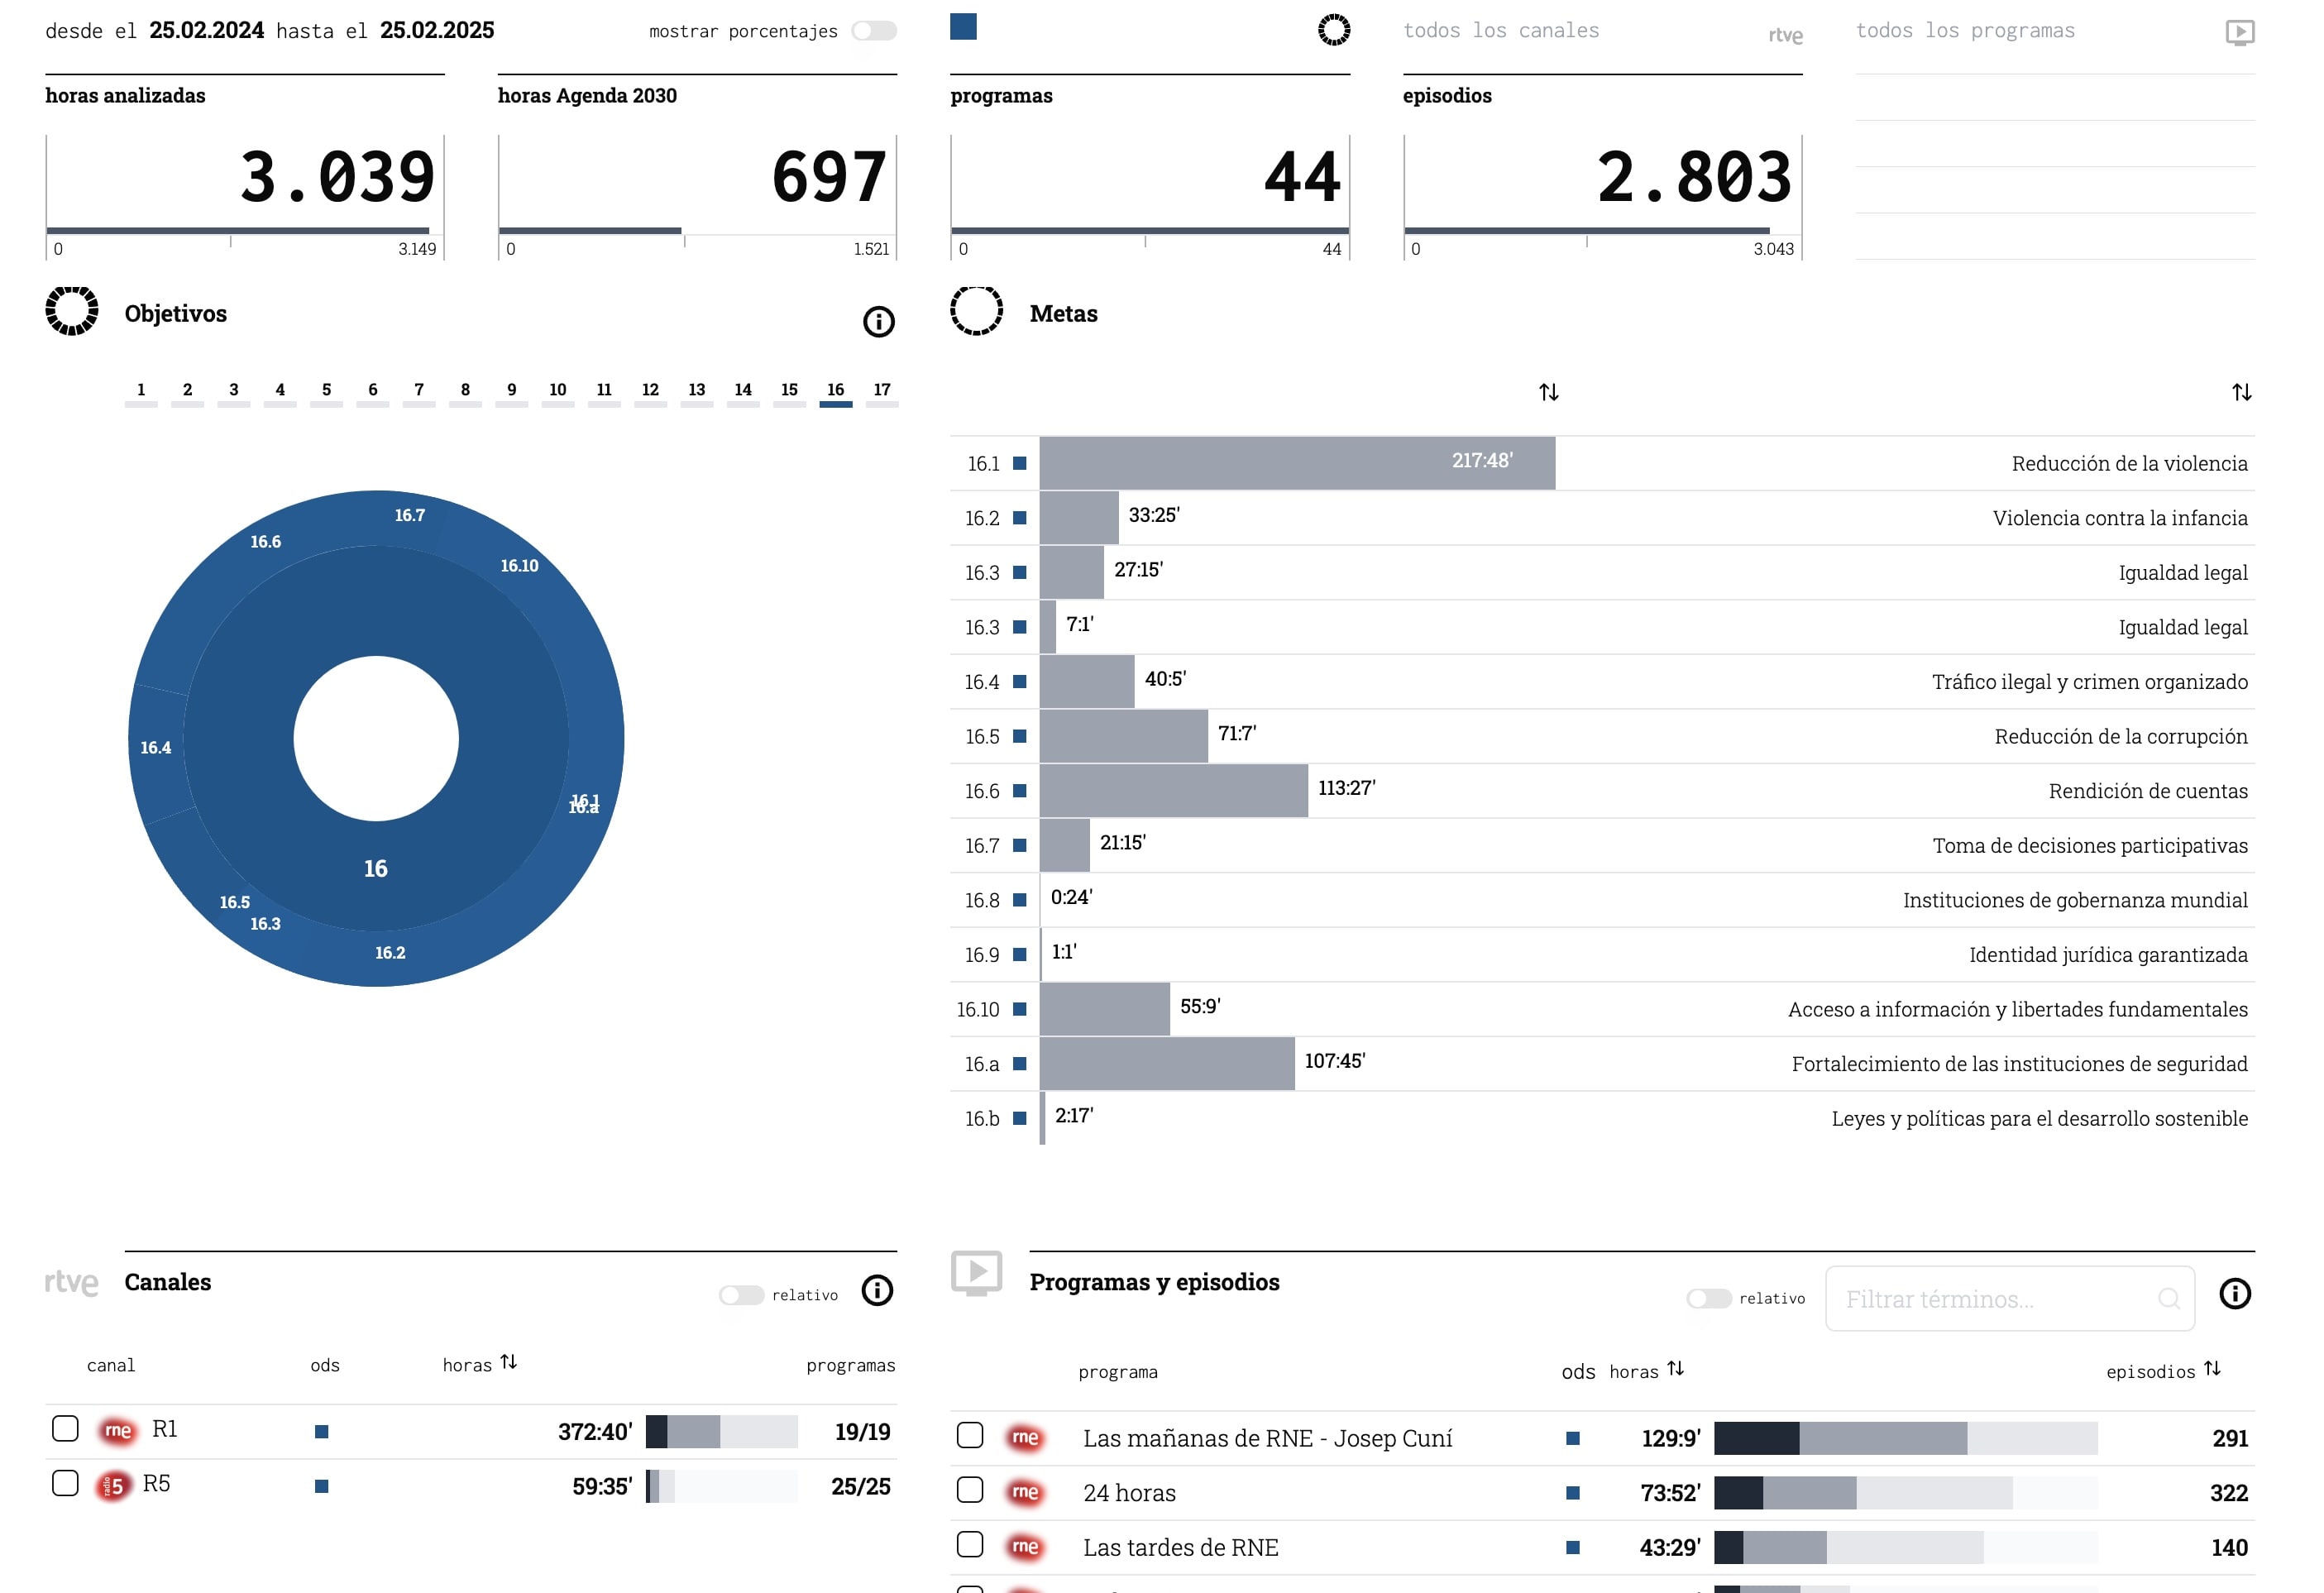
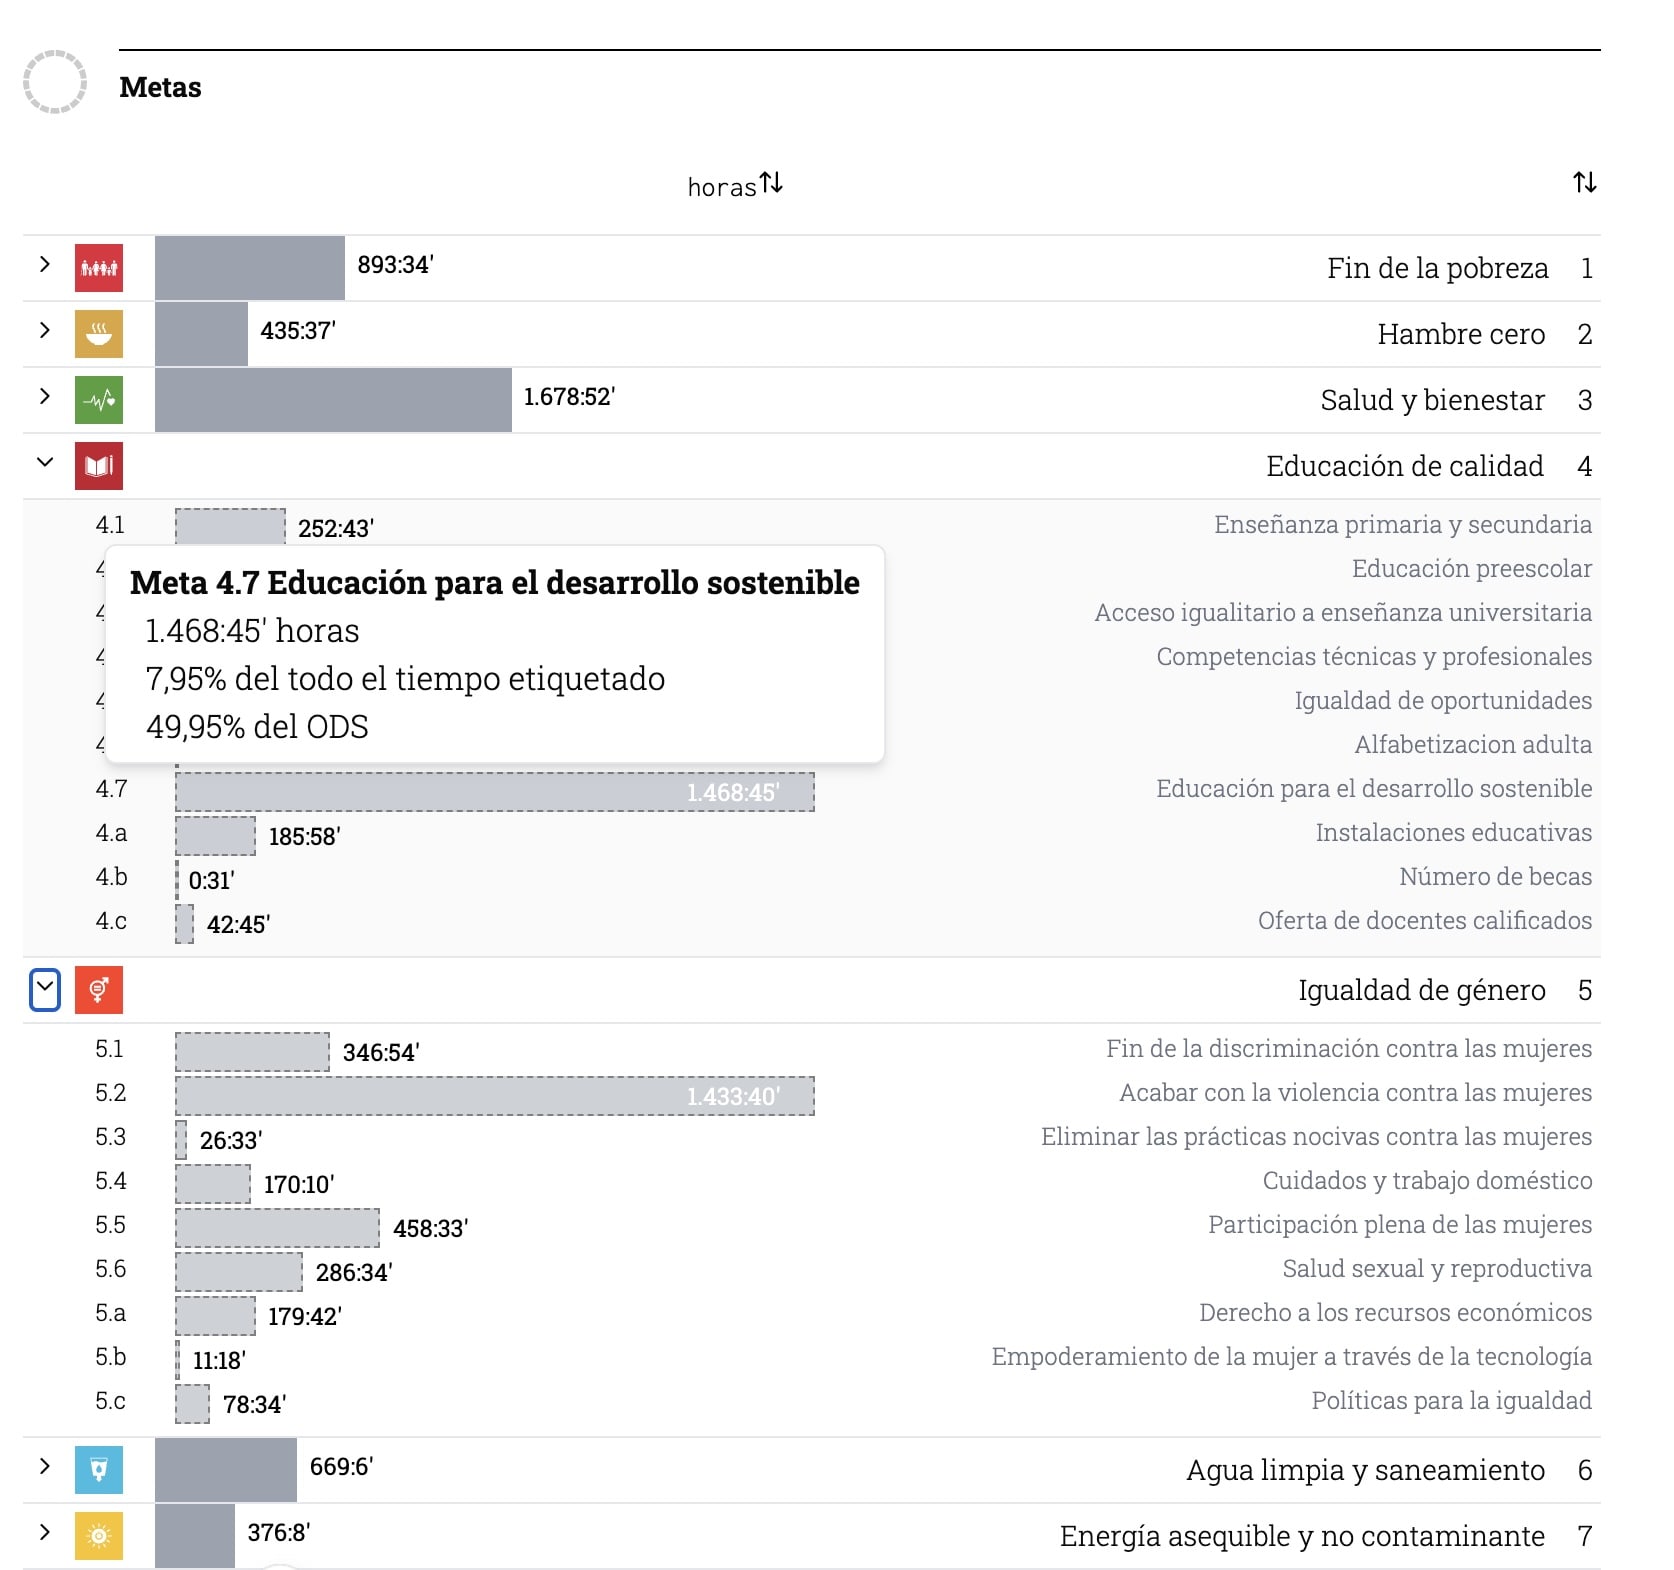
- How many hours have been dedicated to the 2030 Agenda (SDGs and targets)?
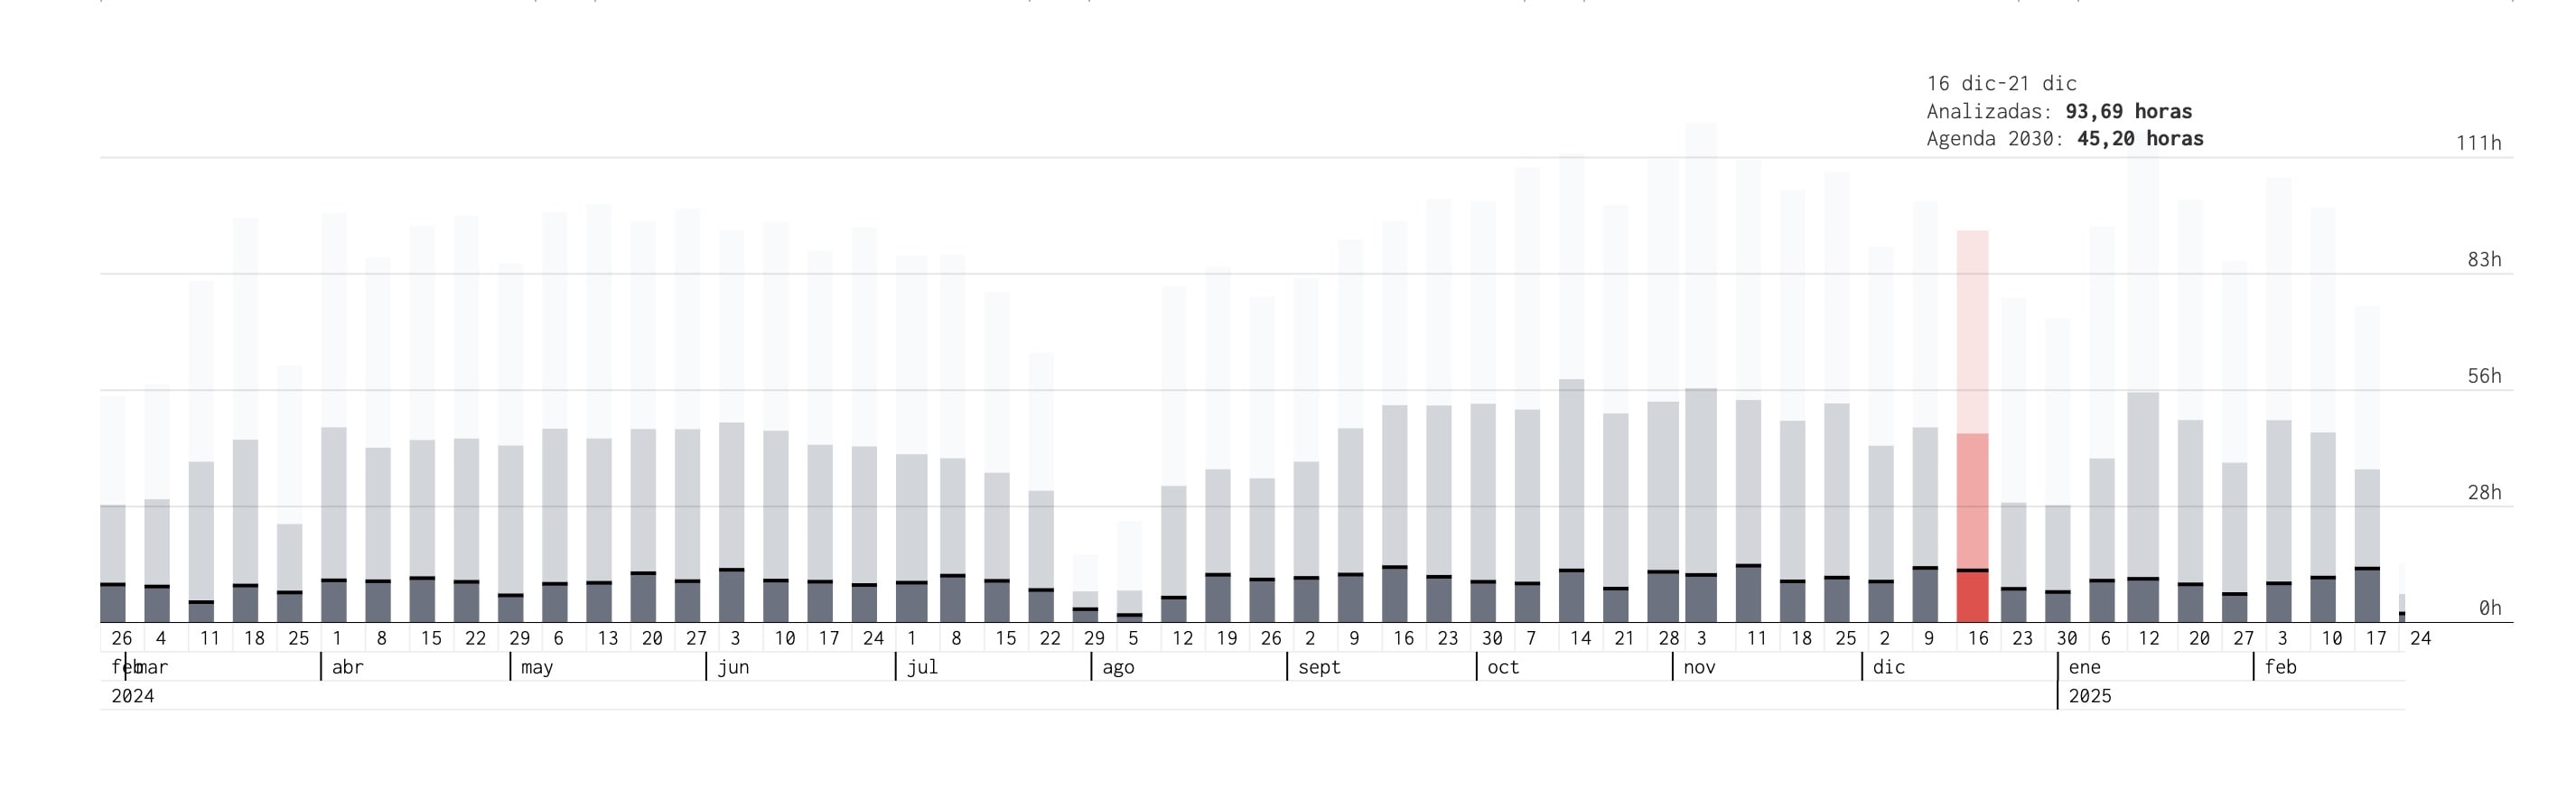
- How has the content associated with each SDG evolved?
- ...
- Additionally, they weren't looking for something static but rather the ability to filter by programs, years, channel... Essentially an interactive data exploration system for decision-making.
Given these needs, we opted for a solution that prioritizes interaction and exploration capabilities.
Solution
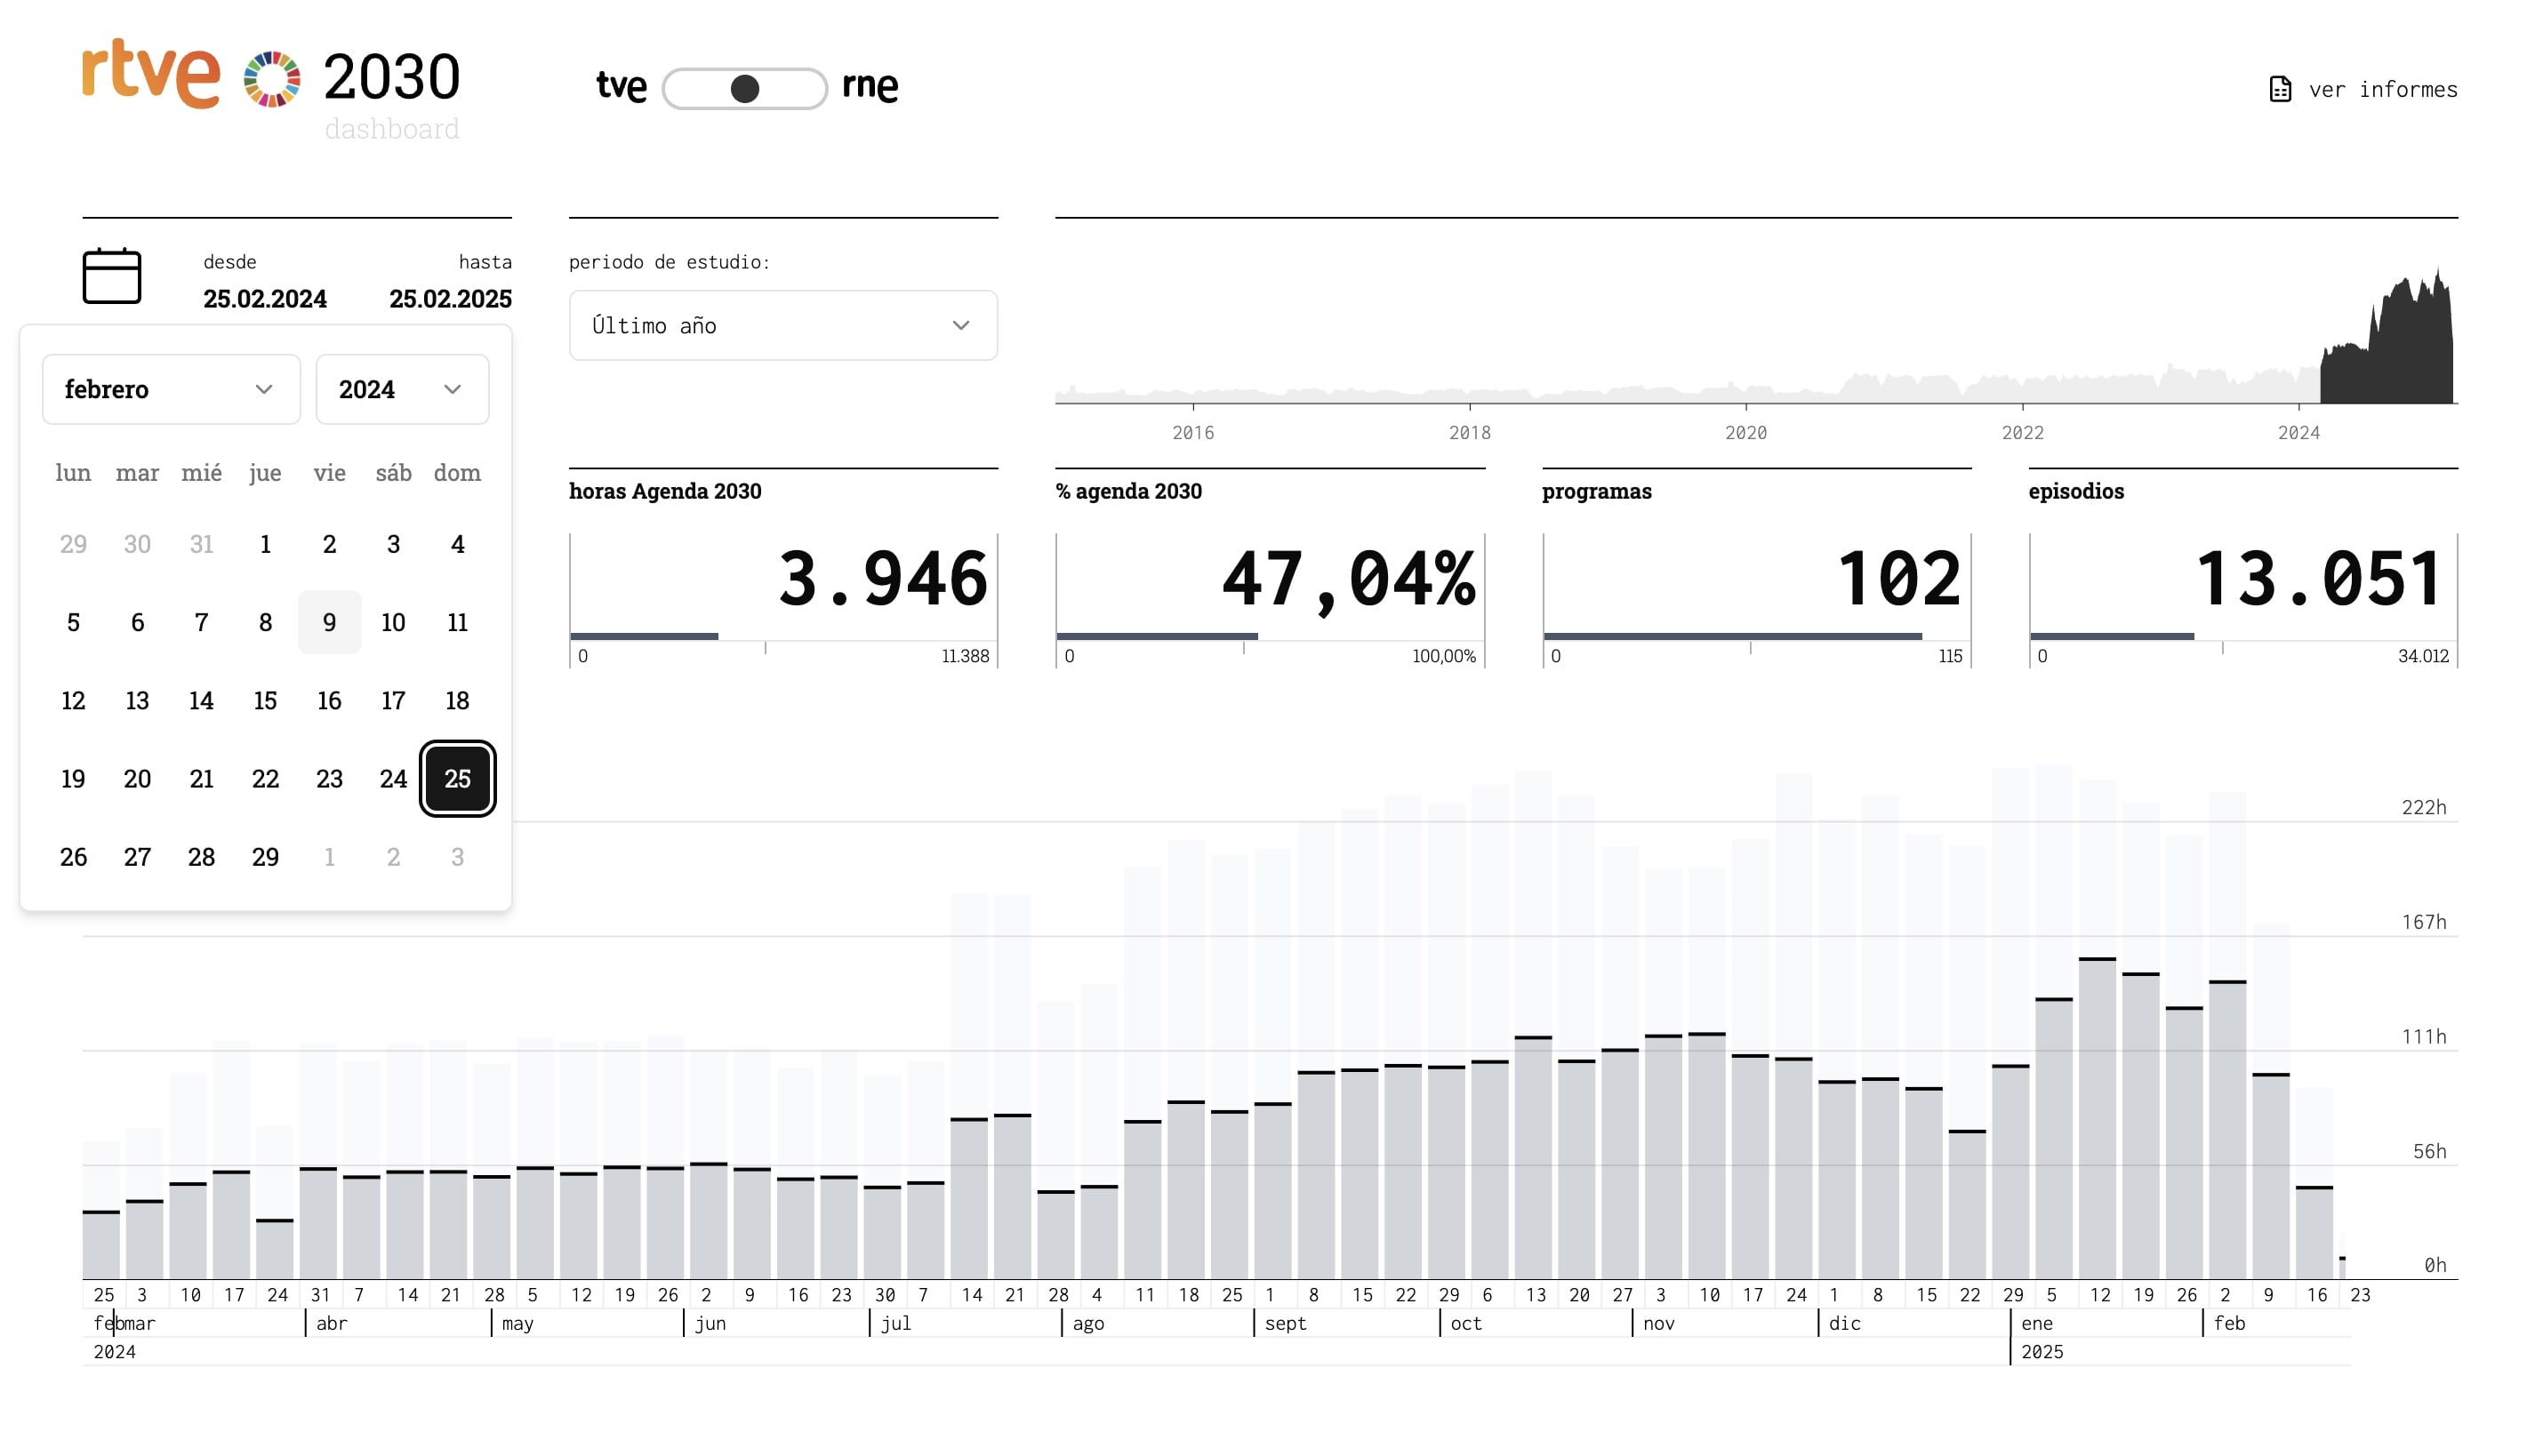
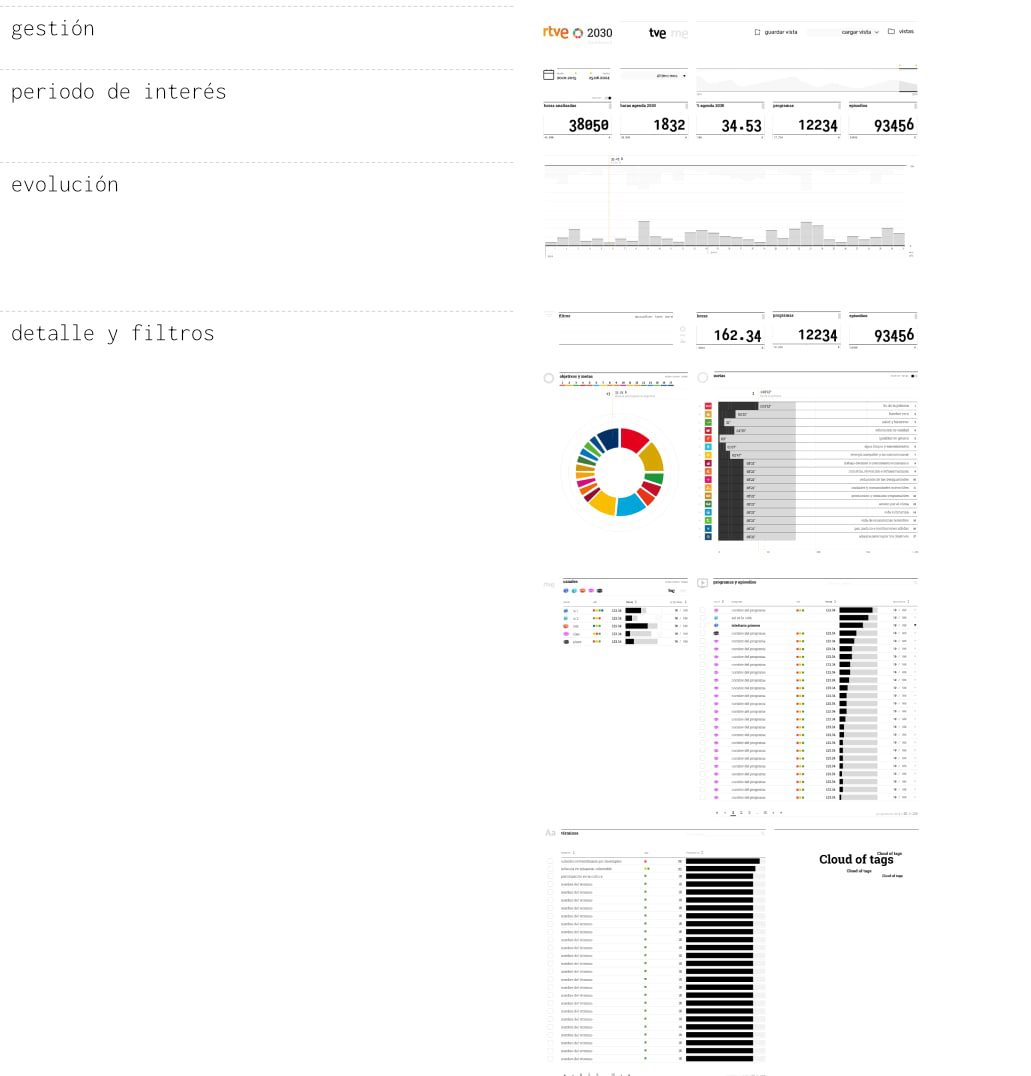
We designed an interface where:
- First, you have a high-level view of the entire period of available data,
- Then you choose the study period
- And finally, you explore the data in detail.
- Each graph can serve as a filter to modify the data in other graphs.
Backend
The data comes from an analysis system designed by Political Watch that connects all non-fiction television and radio production offered by RTVE Play in their API and which, after an analysis based on natural language processing (artificial intelligence), is provided through an API that feeds both the public website of RTVE 2030 and its Dashboard.