LCA Model Browser
A tool to explore product models using life cycle assessment methodology
Scope3 provides consulting services to clients who need to understand the environmental, social, and economic impacts of their actions and decisions. They are experts in life cycle assessment (LCA) and have developed their own modeling software to assess the environmental impacts of products and services.
Goals and challenges
Design an minimum viable product to visually explore the impact models generated with their LCA modeling engine.
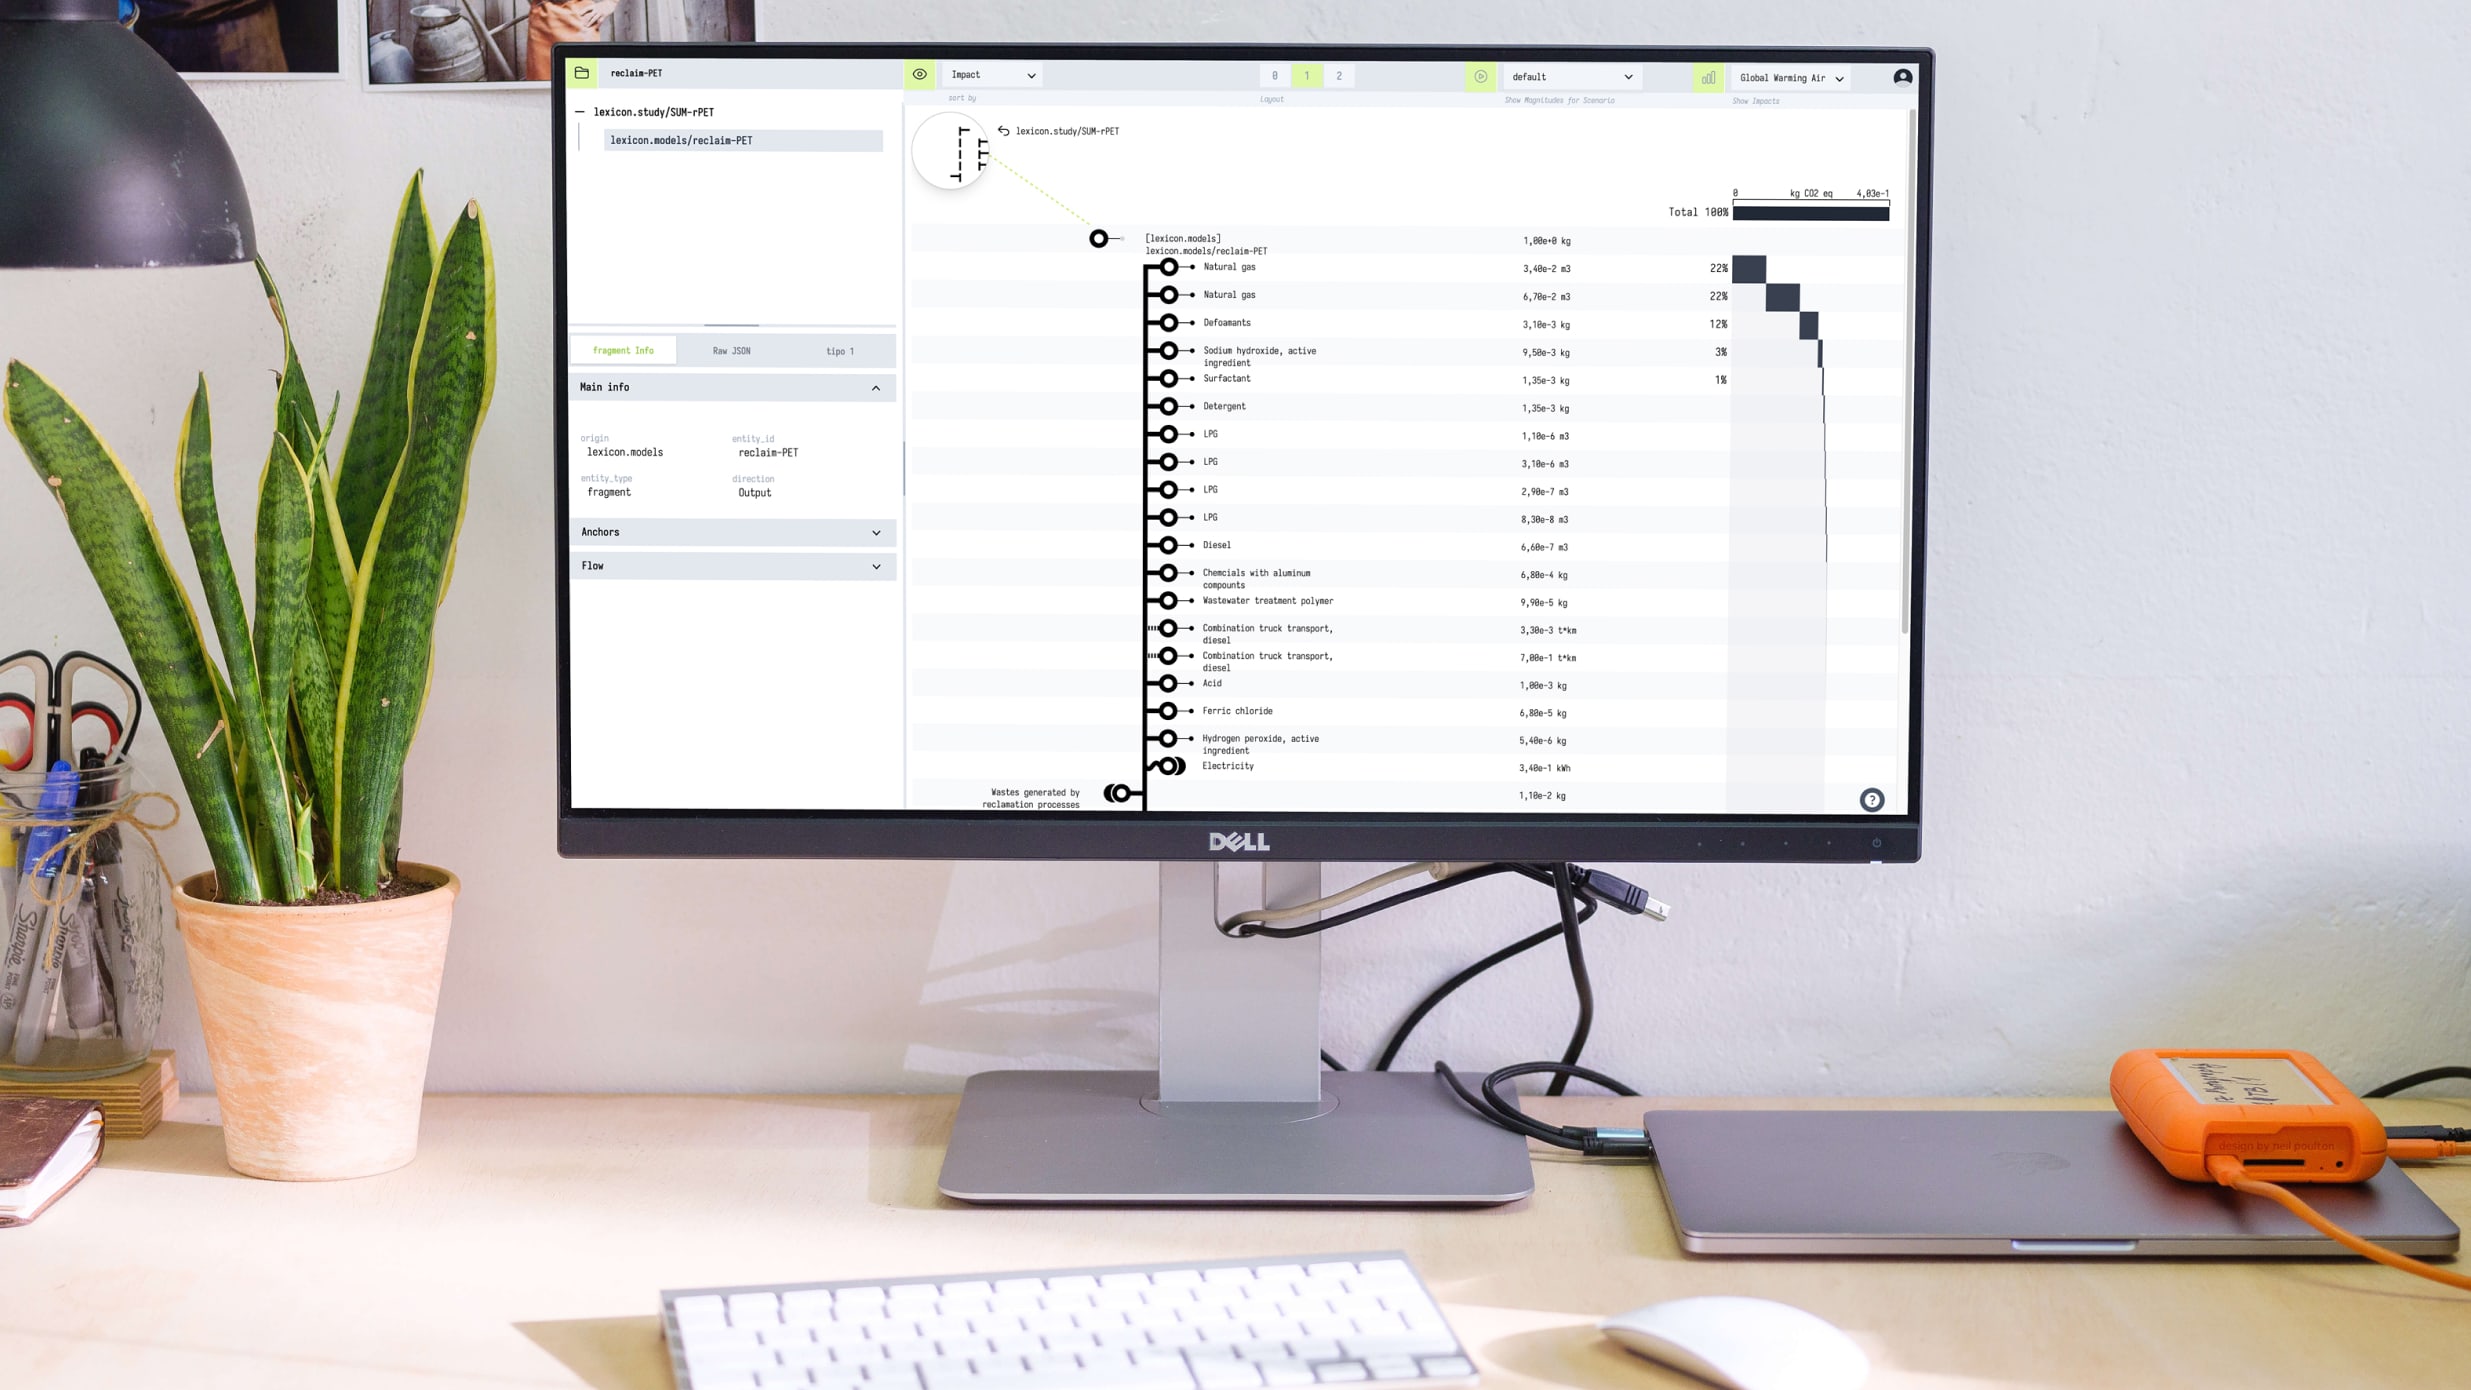
The tool should allow users to navigate through the product database and see the different parts which compose the model, jump to their submodels and obtain the different impact indicators for each part.
Process
Lifecycle assessment is a fairly complex methodology that requires a lot of data and calculations. Scope3 has developed an open source computing model for life cycle assessment.
While most of the tools online are focused on the results of the assessment, Scope3 wanted to provide a tool to explore the model itself.
We started by understanding their data structure and found two major challenges for an MVP:
- 1 Design a scalable visual system to communicate the different types of nodes, flows connections.
- 2 Find the right navigation pattern to move across the models, jump to their submodels and obtain the different impact indicators for each part without the user getting lost.
Scope3 already used a several diagraming systems. So we took inspiration from them and started to sketch some ideas. We also explored some other diagraming systems like Sankey diagrams and other flow diagrams like the petri networks or the Feyneman Diagrams
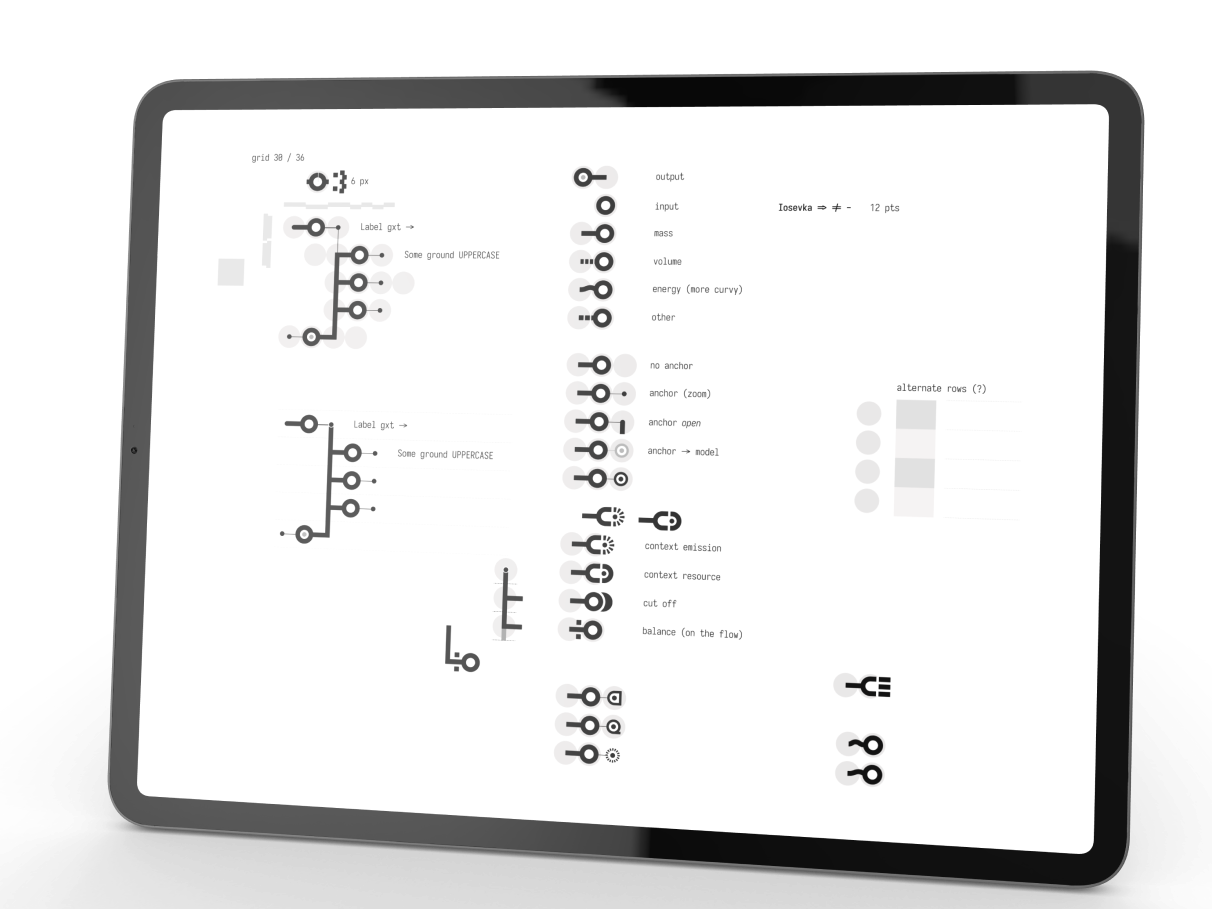
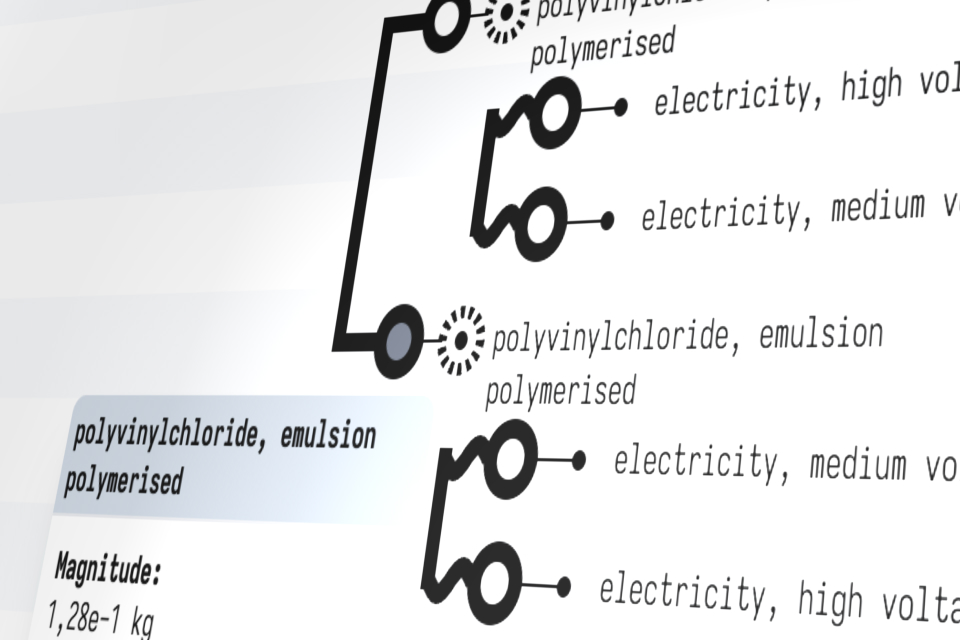
At the end we designed this system were nodes flows and links, are visually grouped as in their model. Input fragments are always represented on the right and output fragments on the left. And then for nodes, flows and links there is a long list of variations.
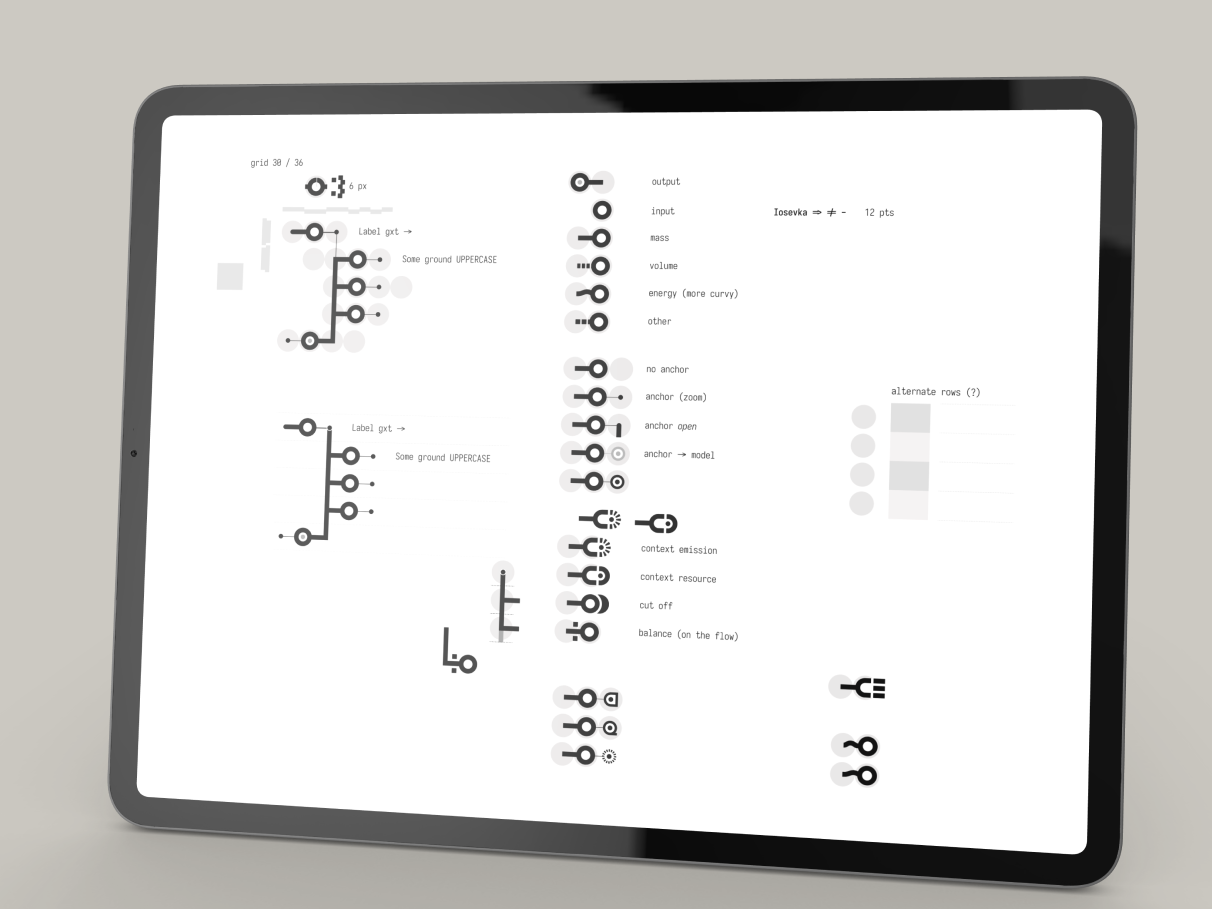 Sketches for the design system
Technical details
The tool is built using VUE3 and NUXT3. We use D3 for most of plotting tasks. The data is loaded directly from their backend. The diagram itself is a SVG element with a lot of D3 magic to make it interactive.
Since this is on going development we cannot share any more images